Criterion App Features
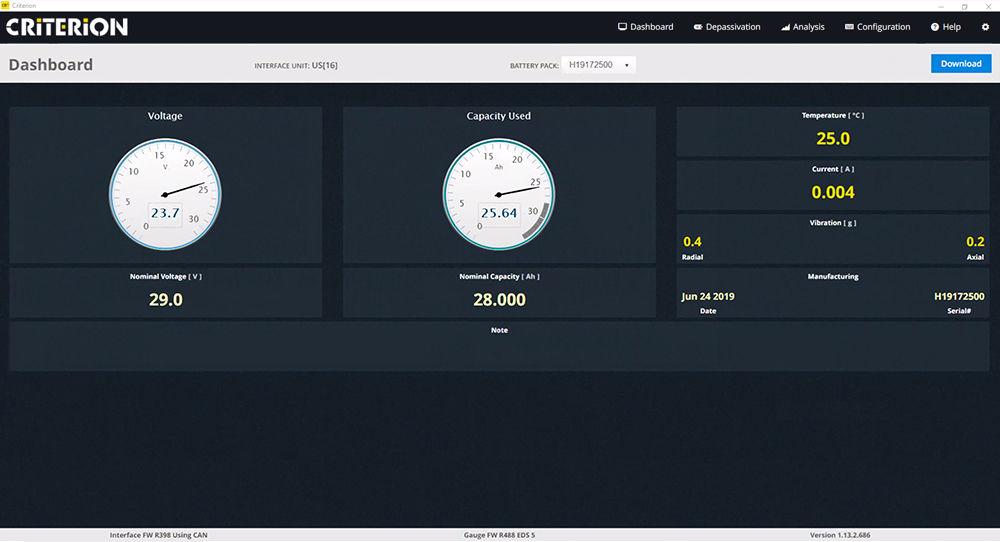
Dashboard
Displays real time Voltage and Capacity Used as well as live readings of Temperature, Current and Vibration. Other information such as Manufacturing Date and Serial Number, and a User Notes field are also displayed.
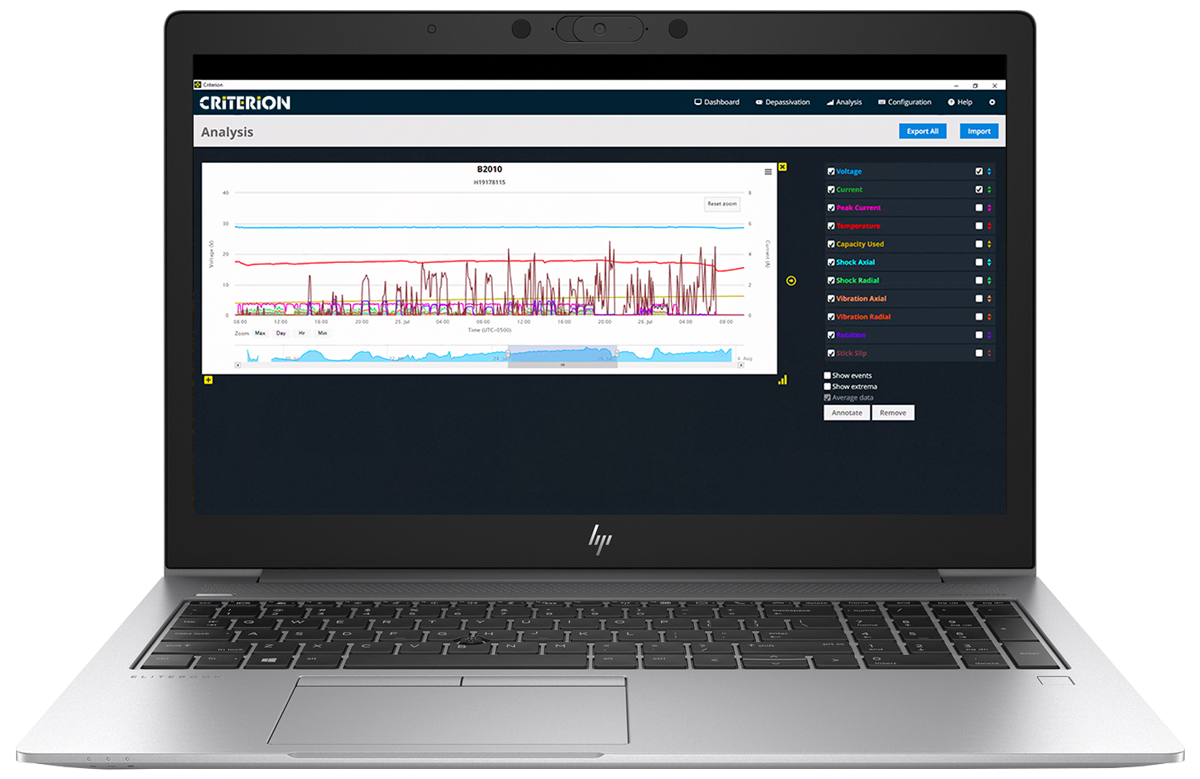
Analysis
Highly graphical display of all logging information recorded. User selectable, multi axis scales, specific point value labels, unlimited zoom levels. Easy export of data and graphs for reports and data sharing.
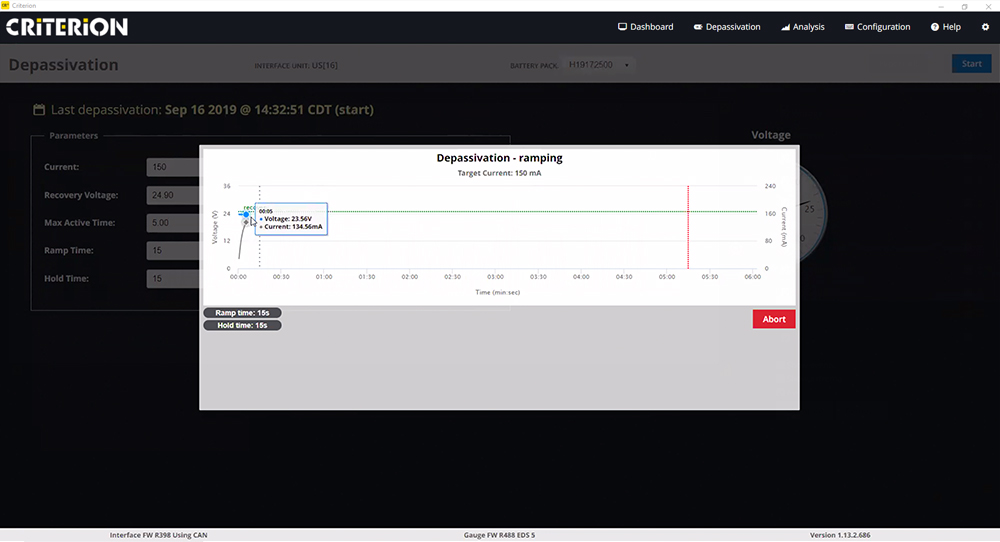
Depassivation
Full function depassivation featuring default parameters specific to the type of battery. Real time depassivation progress pop-up screen display the depassivation procedure progress.
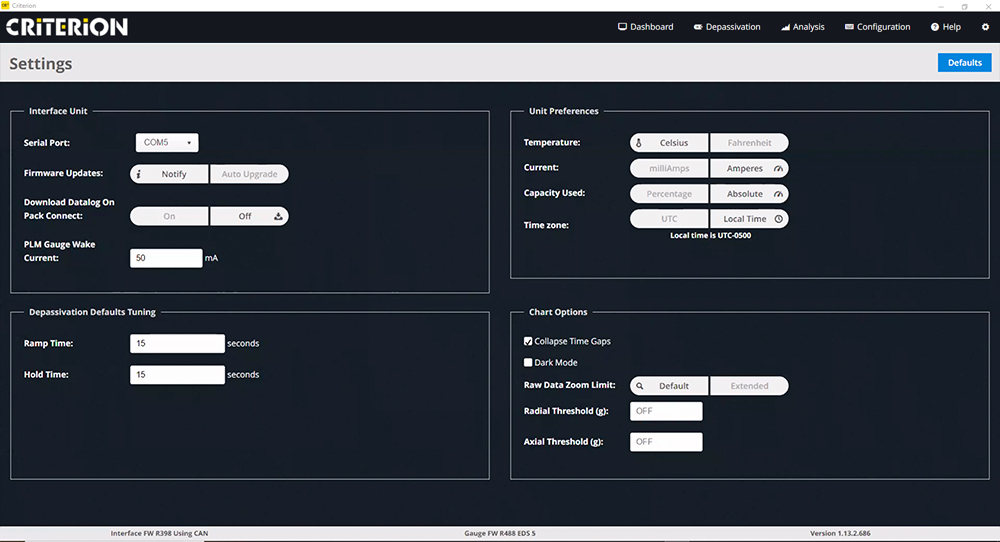
Settings
Interface Unit settings, Unit Preferences, Depassivation Defaults, and Chart Options for graphs, including new “Dark Mode”, can be selected here.

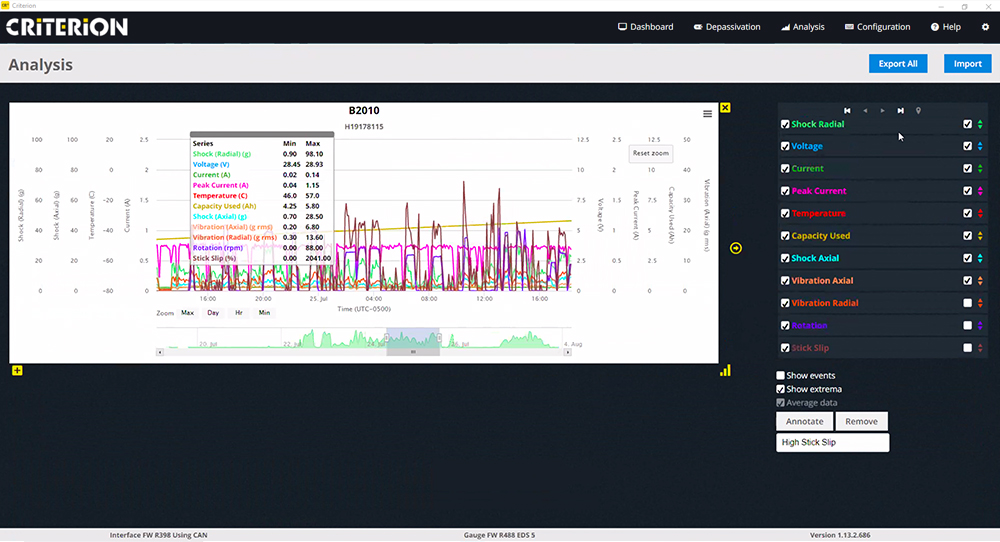
Multiple Scaling
All recorded logging measurements can be displayed in one graph with multiple Y-axis’ enabling an easy and clear view of all data. Individual scales can be positioned on either side of the graph as desired.

Locating Extrema Point
Extrema shows the maximum and minimum values for all displayed logged measurements while also giving the ability to locate each extrema data point along with its date/time stamp.
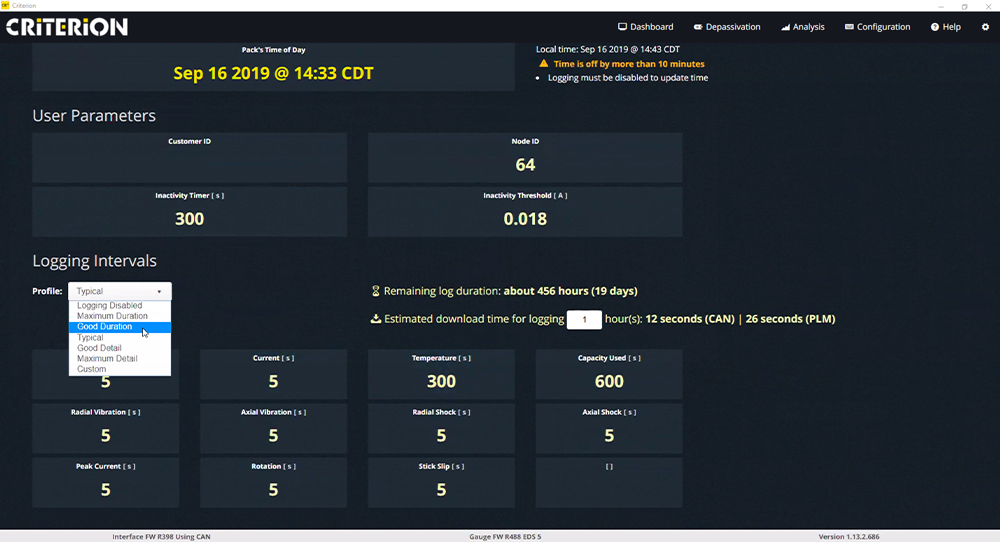
Logging Intervals
Each logged measurement’s logging interval can be individually set determining the resolution of the downloaded data. By selecting a logging interval, the effect on CR4 gauge memory duration can be seen along with an estimation of download time.
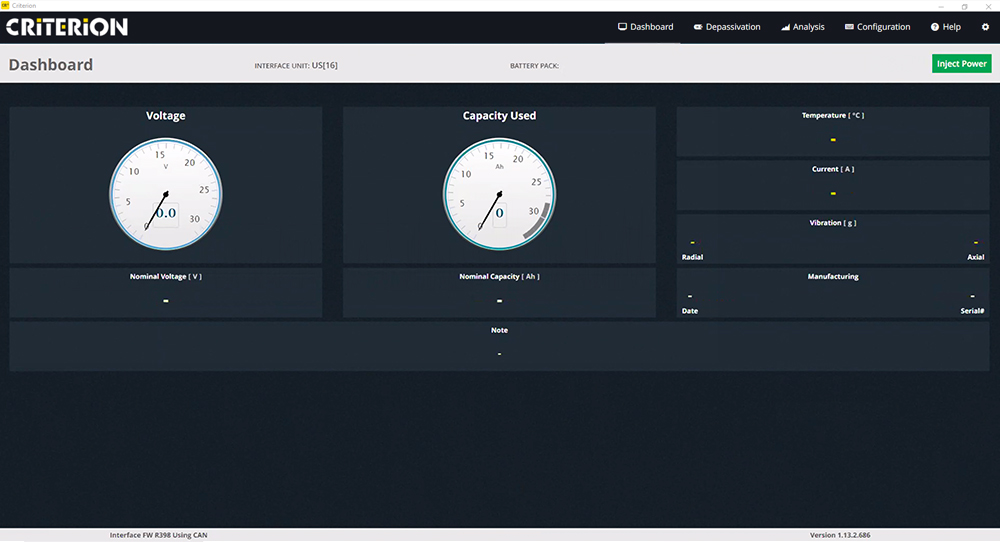
Inject Power
In the event of battery depletion, the Interface Unit can be used to inject power to wake gauge and allow the download of the logged measurements.

Data Files
All data files downloaded from CR4 are formatted as *.ebl files and listed in the Analysis section. Functionalities include import and export of ebl files to other locations including cloud storage.